
Projects
Technical Program: Python (yfinance, sklearn, matplotlib, seaborn)
-
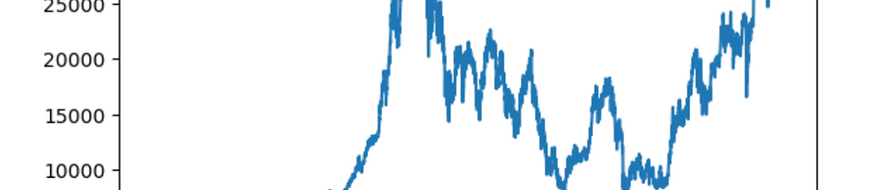
📊 Stock Market Predictive Modeling: Utilized the RandomForestClassifier to develop a predictive model for S&P 500 index movements. Achieved a precision metric of 0.46 by optimizing the model with rolling averages and refining feature selection.
-
🌍 Global Stock Correlation Analysis: Incorporated historical data from the Nikkei 225 index to understand global stock market correlations. Identified a significant correlation of 0.179 between daily changes of the S&P 500 and Nikkei 225, highlighting the potential influence of global markets on the S&P 500.
-
🔍 Comprehensive Data Processing: Executed rigorous data cleaning and preprocessing techniques on extensive stock market datasets. Streamlined the data by removing extraneous columns and handling missing values, ensuring a high-quality dataset for analysis.
Technical Program: Python(pandas, matplotlib, seaborn, nltk, tqdm, transformers
-
📊Developed and Implemented Sentiment Analysis Model: Employed advanced NLP techniques to create a model that analyzed and categorized customer reviews into positive, negative, or neutral sentiments, utilizing Python, NLTK, and the Transformers library.
-
📈 Utilized VADER and Roberta Model for Comparative Analysis: Executed sentiment analysis using VADER for immediate insights and leveraged a pretrained Roberta model to gain deeper, context-rich understanding of customer sentiments, comparing the efficacy of both methodologies.
-
🚦Resolved Complex Runtime Errors: Troubleshooted and rectified numerous runtime errors occurring due to the diverse and extensive dataset, ensuring smooth and accurate analysis of customer reviews.

Technical Program: R | Python | Tableau
-
📊 Developed an interactive Tableau dashboard for in-depth analysis of accident data in London's boroughs.
-
🚦 Cleaned, visualized, and analyzed the data to pinpoint accident-prone areas, providing valuable insights for enhancing safety measures and fostering community well-being.

Technical Program: Microsoft Excel | PowerBi | R | Python | Tableau
-
📈 Designed and developed a "Customer Analysis Dashboard" using R, Python, Excel, and Tableau to consolidate and analyze data from diverse sources for a retail company.
-
💡 Leveraged data insights to optimize product offerings and sales strategies, resulting in a significant impact on the company's operations and profitability.

Technical Program: JavaScript | NodeJS | React | HTML
-
🌐 Designed and developed an e-commerce web application, "UrjaNaturals," using JavaScript, NodeJS, React, and HTML, offering a seamless online shopping experience.
-
💼 The project resulted in a remarkable 10% increase in company sales, showcasing the impact of technology in boosting business growth.
-
📢 Enhanced public outreach and accessibility, providing customers with a convenient platform to purchase dairy products.

Technical Program: JavaScript | NodeJS | React | HTML | Python | R
-
🌐 Engineered a full-stack web application using React, JavaScript, and Node.js framework, leading to a substantial 15% increase in annual sales.
-
📊 Leveraged Python and R for comprehensive data analysis, enabling the creation of data-driven social media campaigns. This strategic approach significantly enhanced brand visibility and boosted customer engagement.

Technical Program: Python
-
🧠 Employed advanced neural networks and Python in a collaborative effort for an AI class project.
-
🏥 Leveraged the Pima Indians Diabetes Database, utilizing data preprocessing and neural network training to identify critical diabetes risk factors.
-
🌐 Designed with collaboration in mind, the model is ready for real-world implementation in healthcare settings, utilizing the power of neural networks and Python.
